Demo 5: Using CAST to align Visium Samples
[1]:
import CAST
import scanpy as sc
import torch, os
import numpy as np
from os.path import join as pj
import warnings
warnings.filterwarnings("ignore")

work_dir = '$work_dir' #### input the demo path
This demo demonstrates CAST Mark and CAST Stack aligning two Visium mouse brain coronal sections. Notably, CAST is able to automatically search and match tissue anatomy in these samples without major changes from the user. This workflow is very similar to that in demos 4, 6 and 7 where CAST Mark and Stack are applied to a variety of samples.
Here is an overview of the workflow:
Load/Prepare Data
Load each dataset (from h5ad files)
Combine the datasets and filter for HVGs
Extract the coordinate and expression data
CAST Alignment
Run CAST Mark
Run CAST Stack
Visualize the Aligned Samples
CAST Mark and CAST Stack produce all of the outputs described in demo 6. For more information about the parameters of CAST Mark and CAST Stack, see demos 1 and 2 respectively.
Load/Prepare Data
[2]:
## Reading input Visium data and setting up the output directory

# Reading in two replicates of Visium data
sdata_Visium1 = sc.read_h5ad(f"{work_dir}/demo5_Visium/data/CytAssist_FFPE_Mouse_Brain_Rep1.h5ad")
sdata_Visium1.obs.rename(columns={'pxl_row_in_fullres':'column','pxl_col_in_fullres':'row'},inplace=True)
sdata_Visium2 = sc.read_h5ad(f"{work_dir}/demo5_Visium/data/CytAssist_FFPE_Mouse_Brain_Rep2.h5ad")
sdata_Visium2.obs.rename(columns={'pxl_row_in_fullres':'column','pxl_col_in_fullres':'row'},inplace=True)

# output directory for the STARmap_vs_SlideSeq demo
output_path = pj(work_dir, "demo5_Visium/demo_output/Visium_vs_Visium") # set output_path
os.makedirs(output_path,exist_ok=True)
[3]:
## Make gene names unique by adding freuqency counts to duplicates

def make_unique(s):
    if s in counts:
        counts[s] += 1
    else:
        counts[s] = 0
    return s if counts[s] == 0 else f"{s}_{counts[s]}"

counts = {}
sdata_Visium1.var.index = sdata_Visium1.var.index.map(make_unique)
counts = {}
sdata_Visium2.var.index = sdata_Visium2.var.index.map(make_unique)
[4]:
## Combine the two Visium datasets

from CAST.utils import detect_highly_variable_genes


# combine the two datasets
sample_list= ['Visium1','Visium2'] # [Query, Reference]
sdata = sdata_Visium1.concatenate(sdata_Visium2)

# rename the dataset labels to Visium1 and Visium2
batch_key = 'batch'
batch_rename = {'0' : sample_list[0],'1' : sample_list[1]}
sdata.obs.replace({batch_key:batch_rename},inplace=True)

# Filter for highly variable genes
sdata.var['highly_variable'] = detect_highly_variable_genes(sdata,batch_key=batch_key,n_top_genes=4000,count_layer='.X')
sdata = sdata[:,sdata.var['highly_variable']]

# Output the combined dataset
sdata.write_h5ad(f'{output_path}/Visium_vs_Visium.h5ad')
[5]:
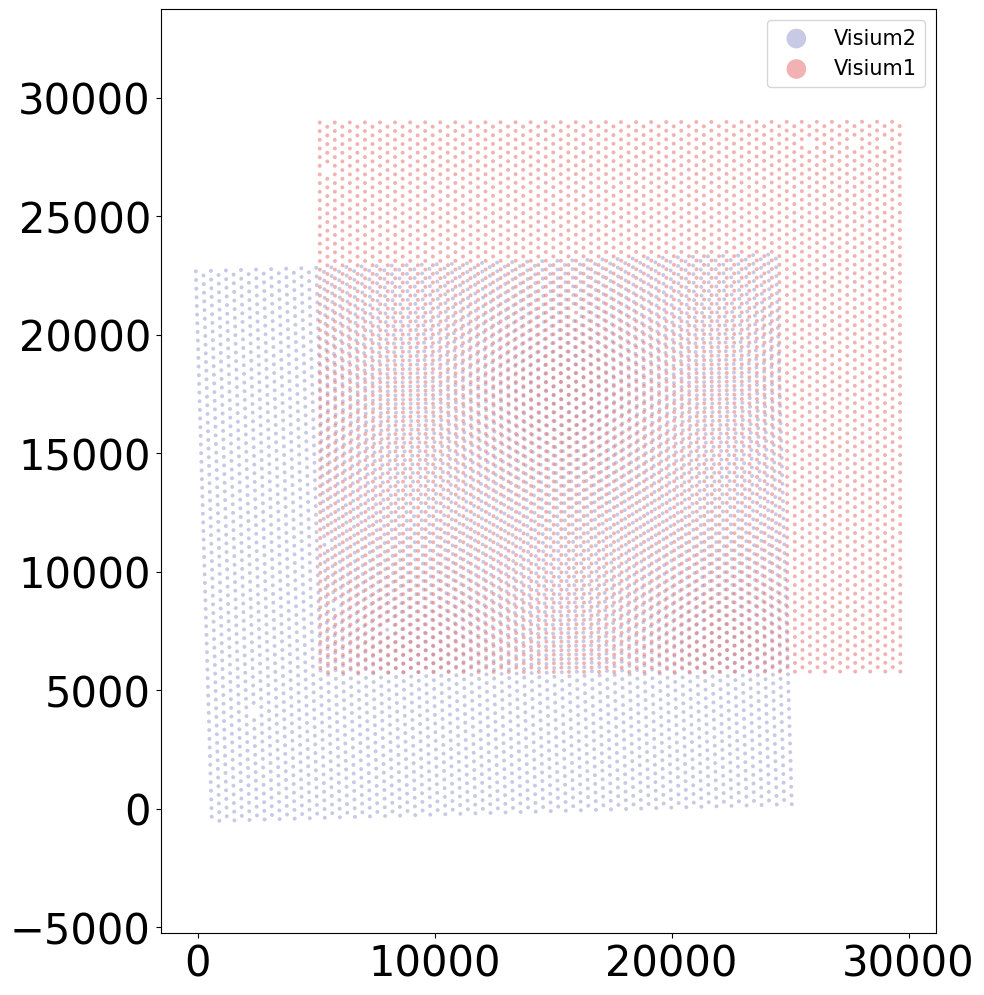
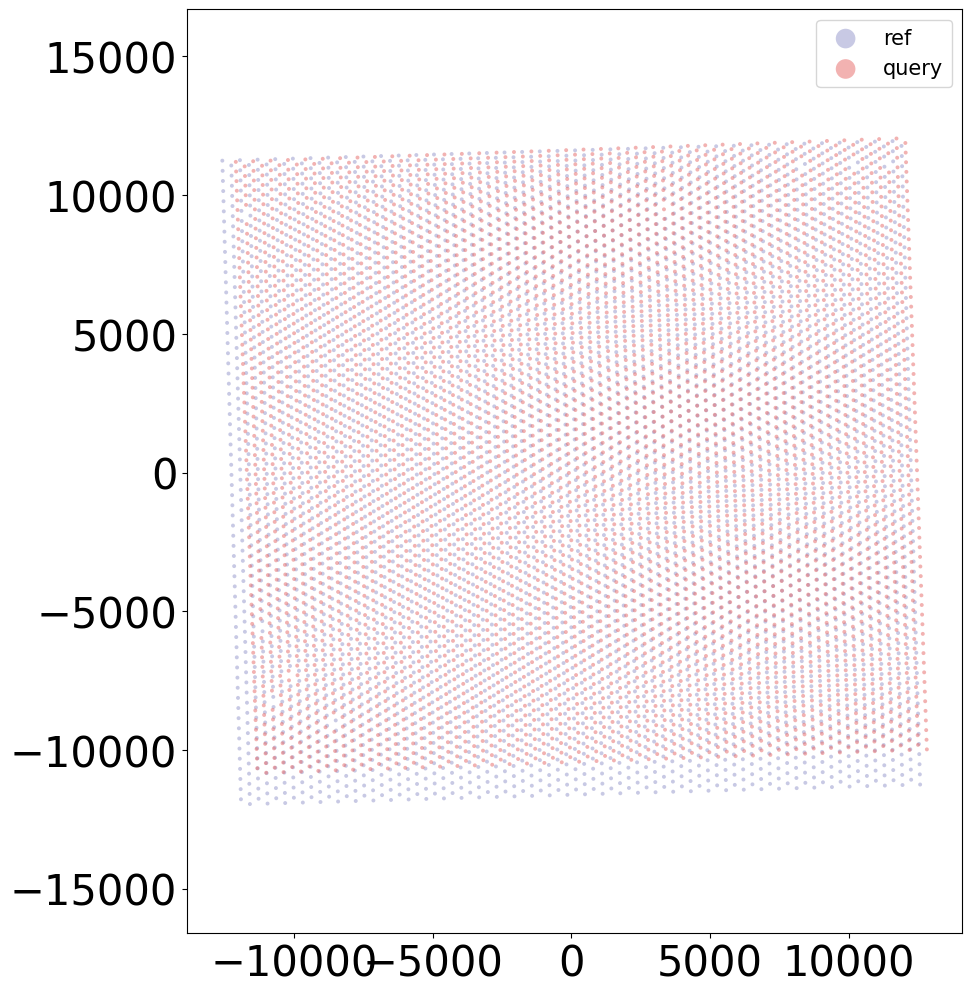
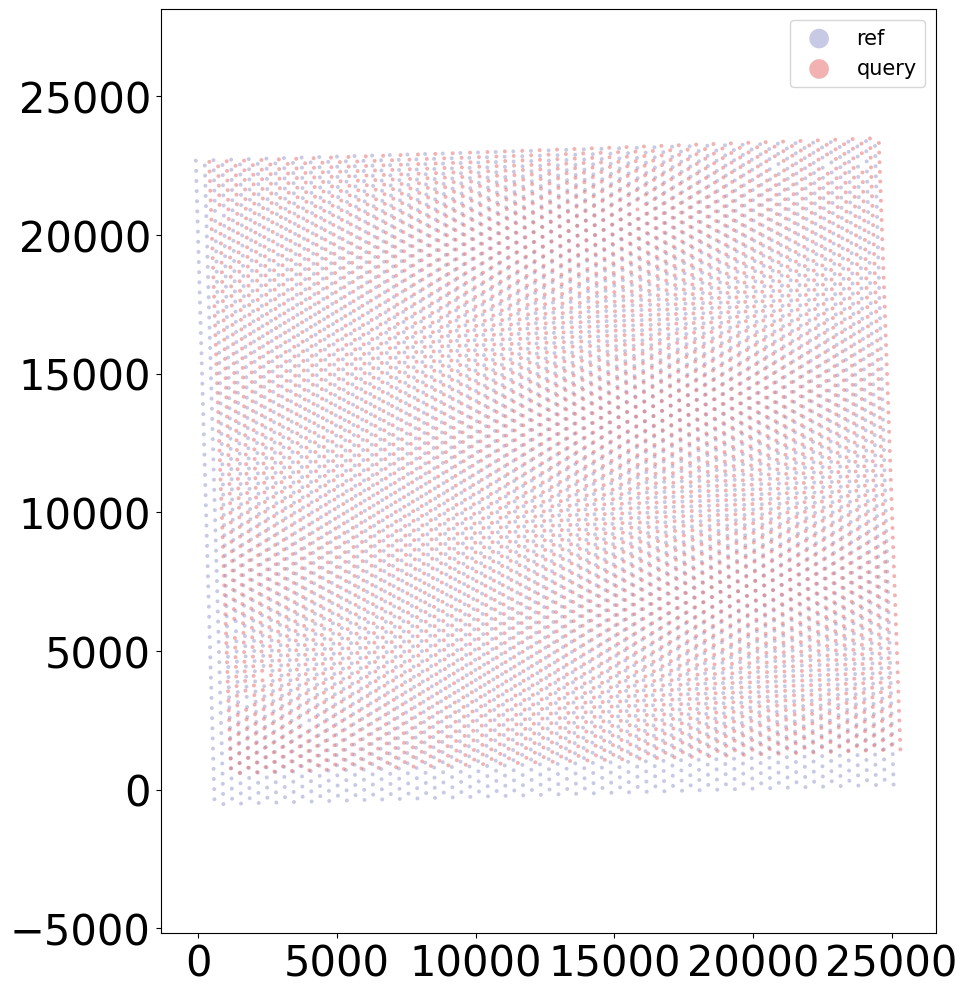
## Visualize the combined data (before CAST is applied)

from CAST.visualize import plot_mid


coords_t = np.array(sdata.obs[['column', 'row']])
plot_mid(coords_t[sdata.obs[batch_key] == sample_list[0]],
         coords_t[sdata.obs[batch_key] == sample_list[1]],
         output_path=output_path,
         filename = 'Align_raw',
         title_t = [sample_list[1],
                    sample_list[0]],
         s_t = 8,scale_bar_t = None)
[6]:
## Extract and subset the coordinate and expression data for each sample

from CAST.utils import extract_coords_exp


coords_raw,exps = extract_coords_exp(sdata, batch_key = 'batch', cols = ['column', 'row'], count_layer = '.X', data_format = 'norm1e4')
torch.save(coords_raw, f'{output_path}/coords_raw.pt')
Preprocessing...
CAST Mark
[7]:
## Run CAST Mark — capture common spatial features
from CAST.models.model_GCNII import Args
from CAST import CAST_MARK
from CAST.visualize import kmeans_plot_multiple
# set the parameters for CAST Mark
args = Args(
dataname='task1', # name of the dataset, used to save the log file
gpu = 0, # gpu id, set to zero for single-GPU nodes
epochs=400, # number of epochs for training
lr1= 1e-3, # learning rate
wd1= 0, # weight decay
lambd= 1e-3, # lambda in the loss function, refer to online methods
n_layers=2, # number of GCNII layers, more layers mean a deeper model, larger reception field, at a cost of VRAM usage and computation time
der=0.5, # edge dropout rate in CCA-SSG
dfr=0.3, # feature dropout rate in CCA-SSG
use_encoder=True, # perform a single-layer dimension reduction before the GNNs, helps save VRAM and computation time if the gene panel is large
encoder_dim=512, # encoder dimension, ignore if `use_encoder` set to `False`
)
# run CAST Mark
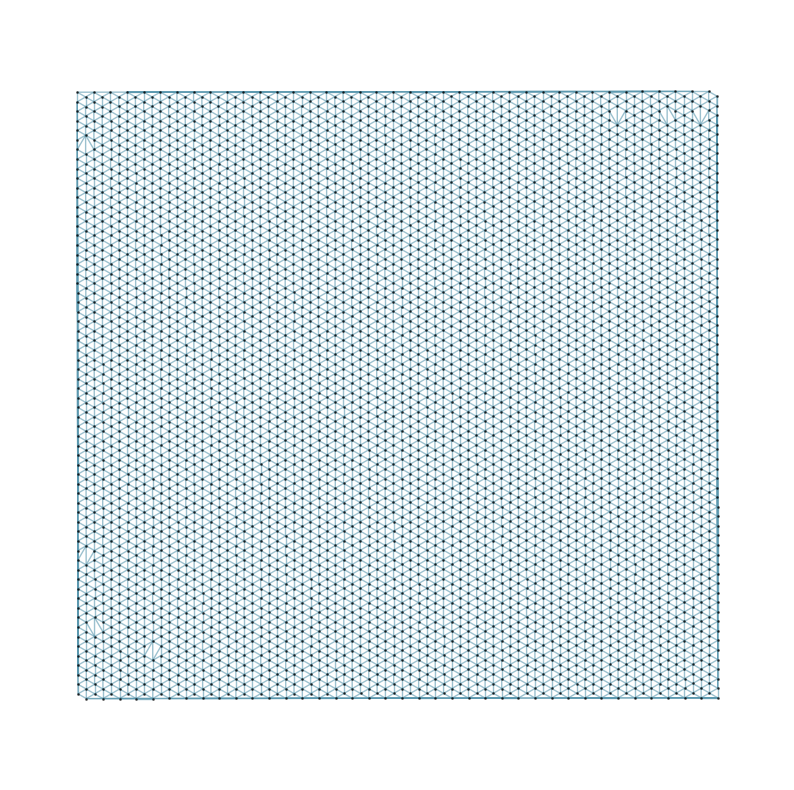
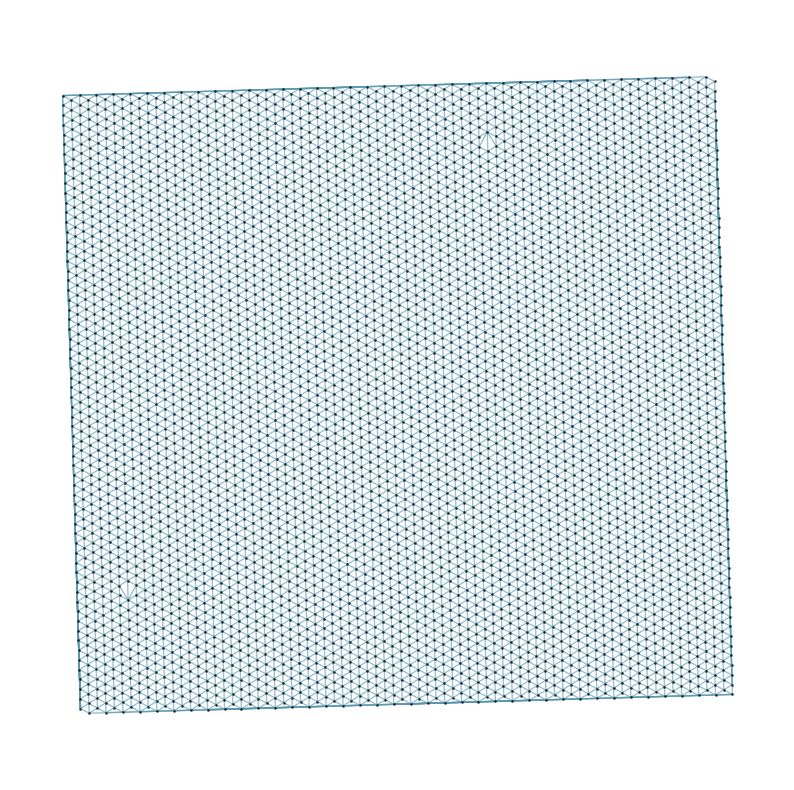
embed_dict = CAST_MARK(coords_raw,exps,output_path,args = args,graph_strategy='delaunay')
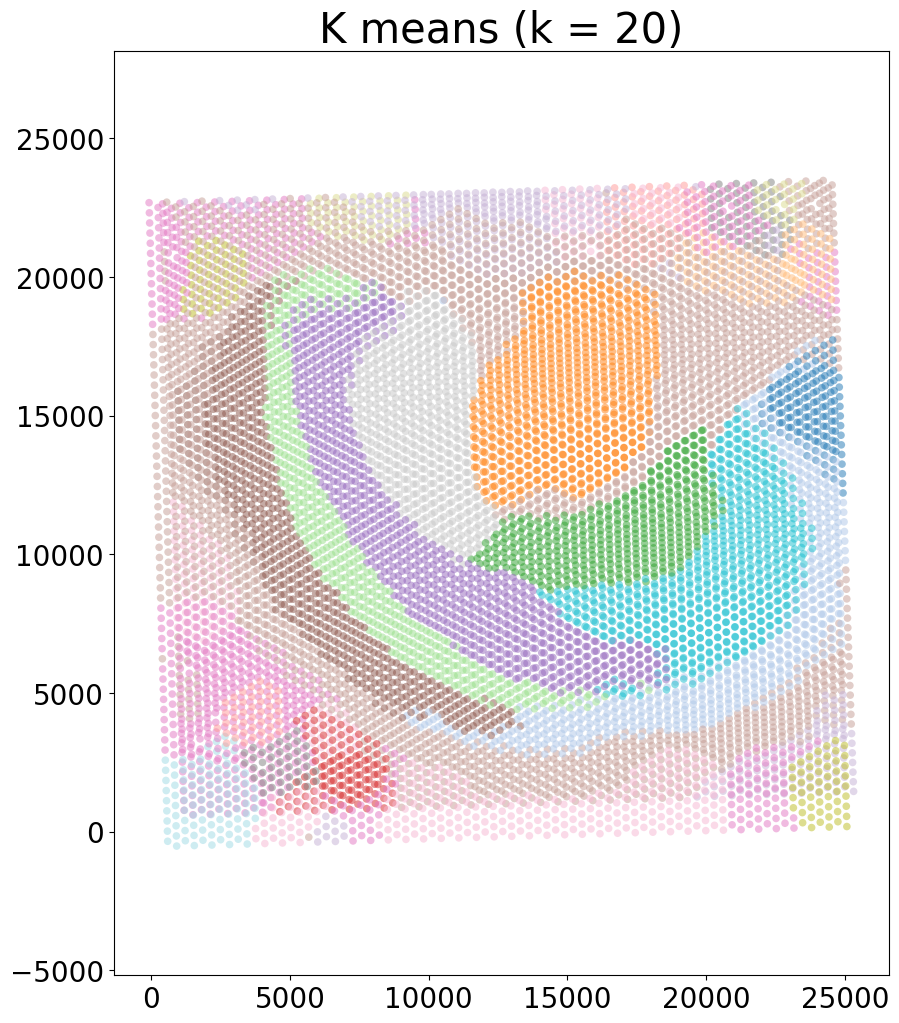
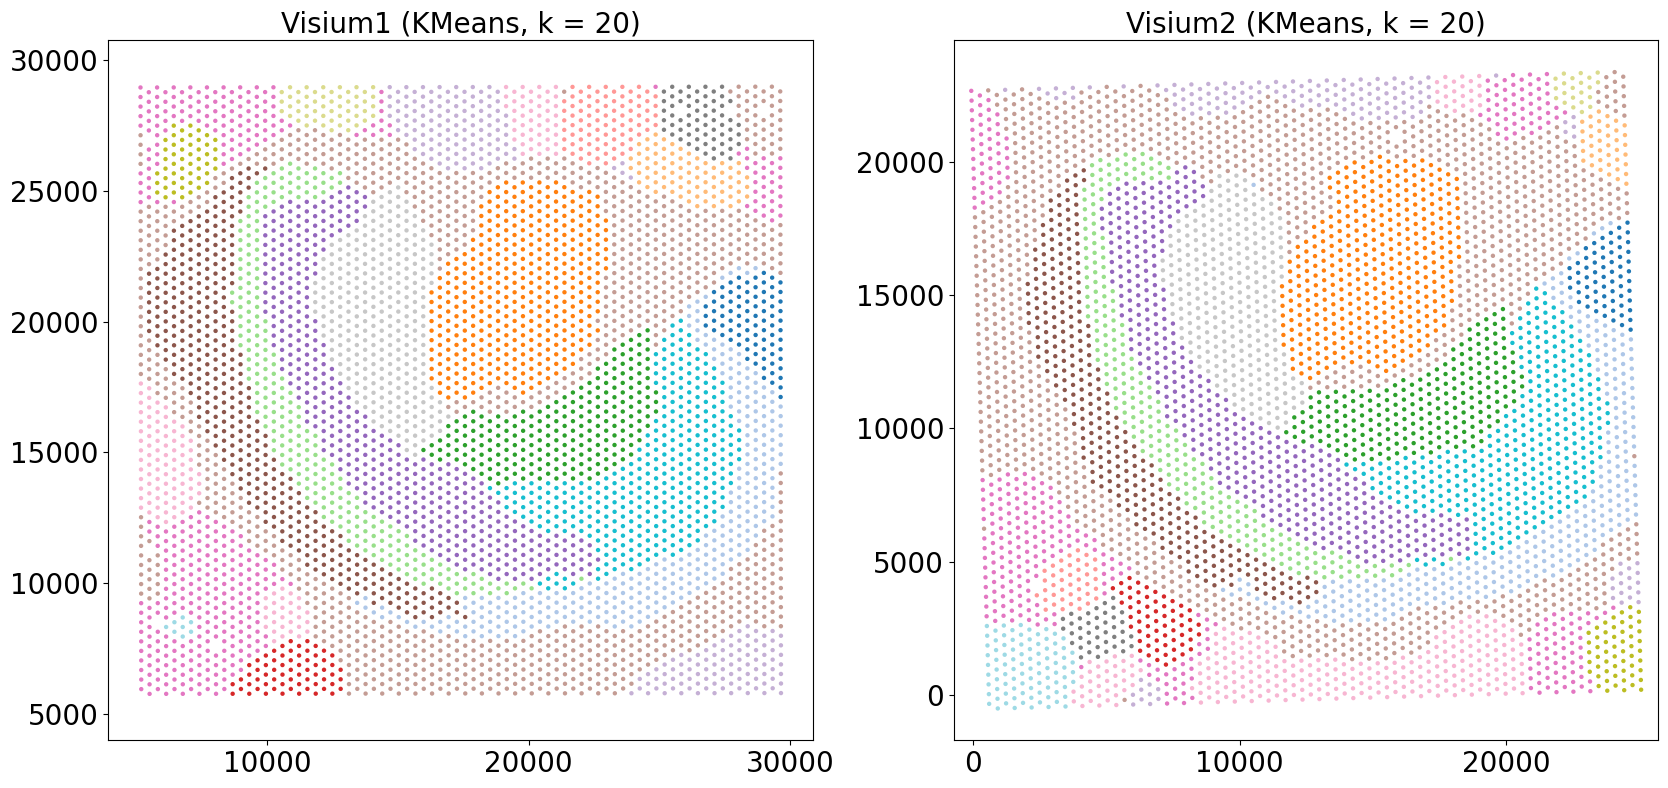
# plot the results
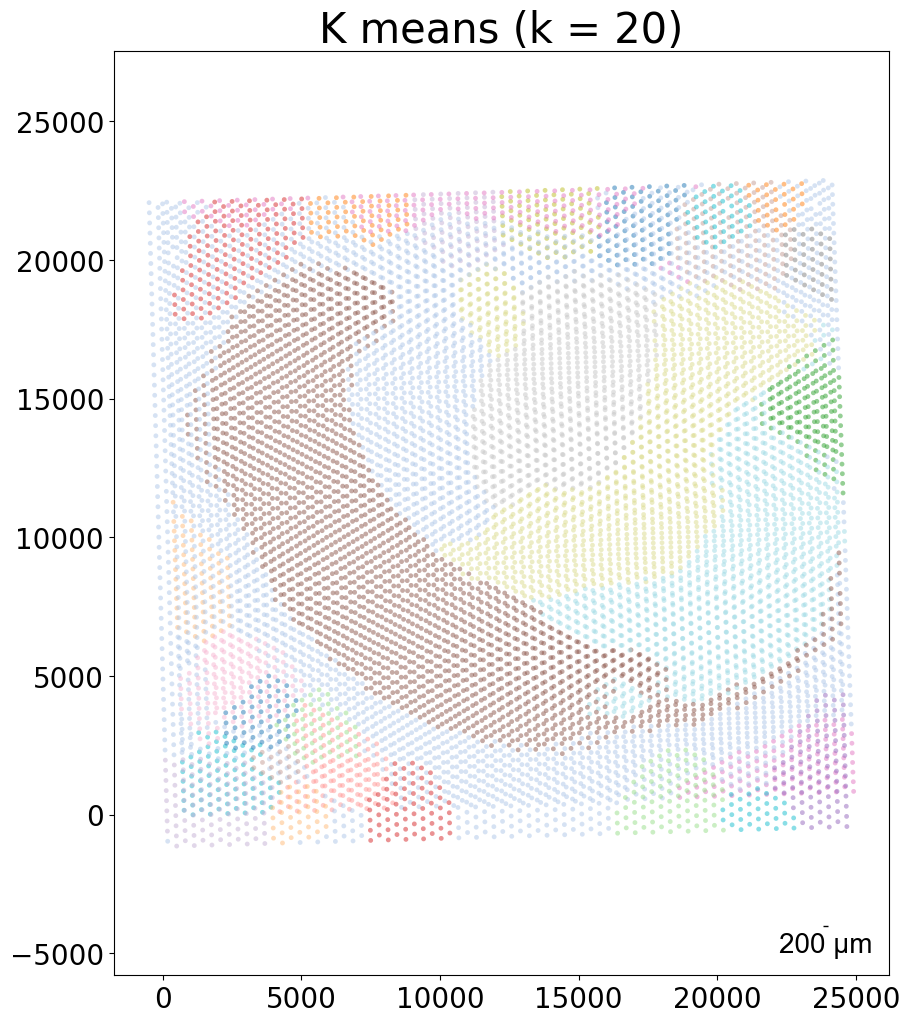
kmeans_plot_multiple(embed_dict,sample_list,coords_raw,'demo1',output_path,k=20,dot_size = 10,minibatch=True)
Constructing delaunay graphs for 2 samples...
Training on cuda:0...
Loss: -465.264 step time=0.036s: 100%|███████████████████████████████████████████████████████████████████████████████████████████████████████████████████████████████████████| 400/400 [00:21<00:00, 18.47it/s]
Finished.
The embedding, log, model files were saved to /home/unix/panj/wanglab/jessica/CAST/demo/demo5_Visium/demo_output/Visium_vs_Visium
Perform KMeans clustering on 9975 cells...
Plotting the KMeans clustering results...
[7]:
array([12, 12, 4, ..., 18, 8, 9], dtype=int32)
CAST Stack
[8]:
## Run CAST Stack — align the two samples
from CAST.CAST_Stack import reg_params
from CAST import CAST_STACK
# set the parameters for CAST Stack
query_sample = sample_list[0]
params_dist = reg_params(dataname = query_sample,
gpu = 0 if torch.cuda.is_available() else -1,
#### Affine parameters
iterations=150,
dist_penalty1=0,
bleeding=500,
d_list = [3,2,1,1/2,1/3],
attention_params = [None,3,1,0],
#### FFD parameters
dist_penalty2 = [0],
alpha_basis_bs = [0],
meshsize = [8],
iterations_bs = [1],
attention_params_bs = [[None,3,1,0]],
mesh_weight = [None])
# set the alpha basis for the affine transformation
params_dist.alpha_basis = torch.Tensor([1/1000,1/1000,1/50,5,5]).reshape(5,1).to(params_dist.device)
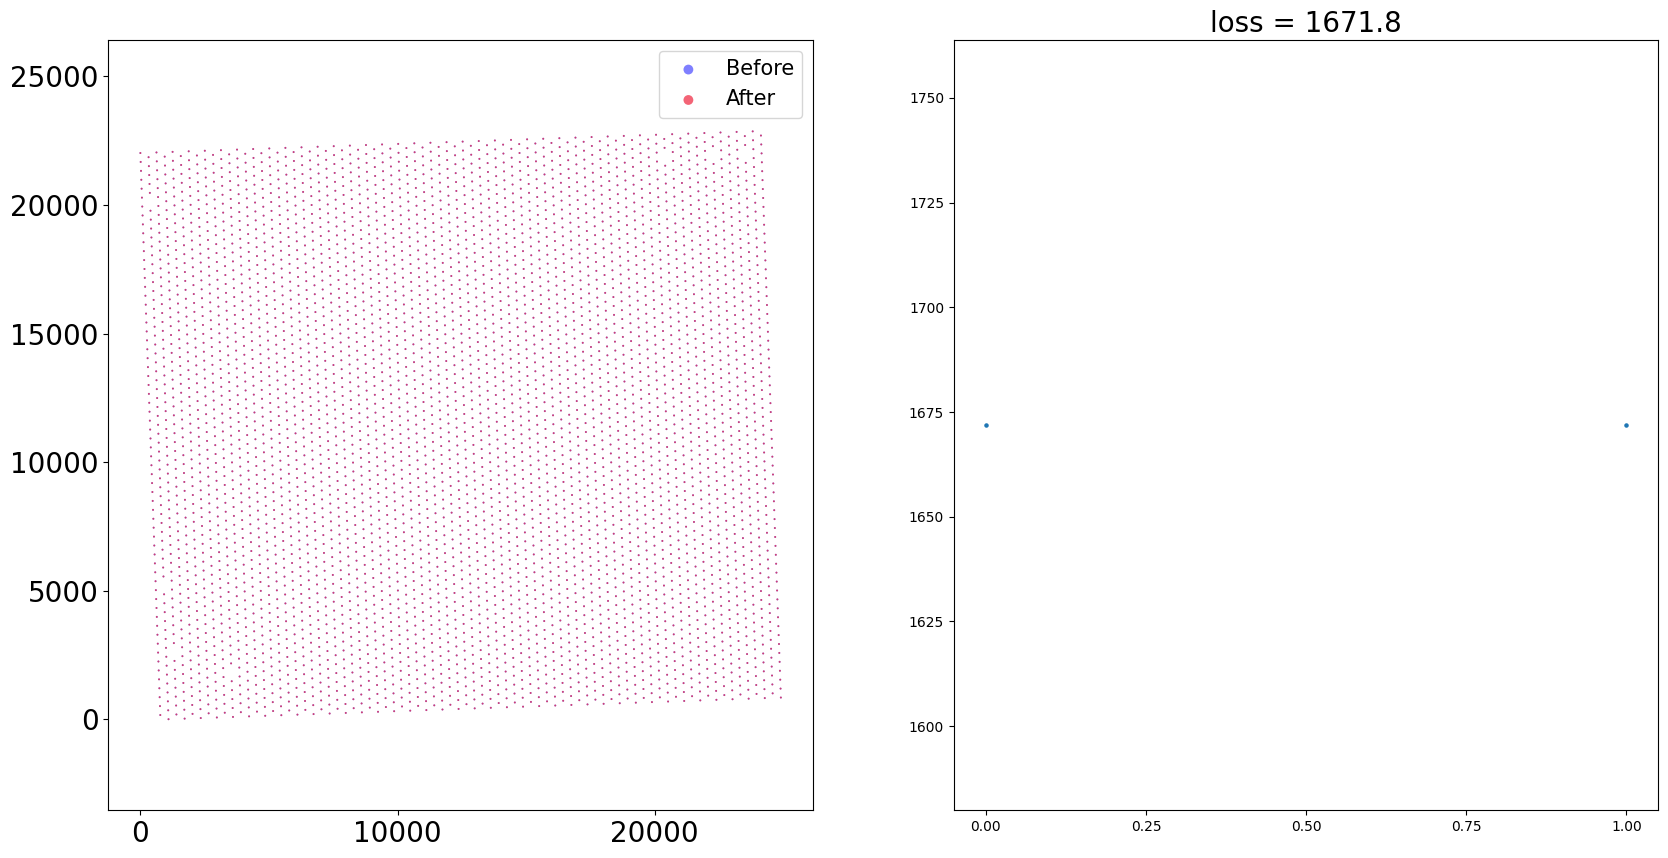
# run CAST Stack
coord_final = CAST_STACK(coords_raw,embed_dict,output_path,sample_list,params_dist,sub_node_idxs = None)
Loss: 1671.817: 100%|████████████████████████████████████████████████████████████████████████████████████████████████████████████████████████████████████████████████████████| 150/150 [00:02<00:00, 59.65it/s]
Loss: 1671.817: 100%|████████████████████████████████████████████████████████████████████████████████████████████████████████████████████████████████████████████████████████████| 1/1 [00:00<00:00, 15.32it/s]
100%|████████████████████████████████████████████████████████████████████████████████████████████████████████████████████████████████████████████████████████████████████████████| 1/1 [00:00<00:00, 57.78it/s]


Visualize the Aligned Data
[9]:
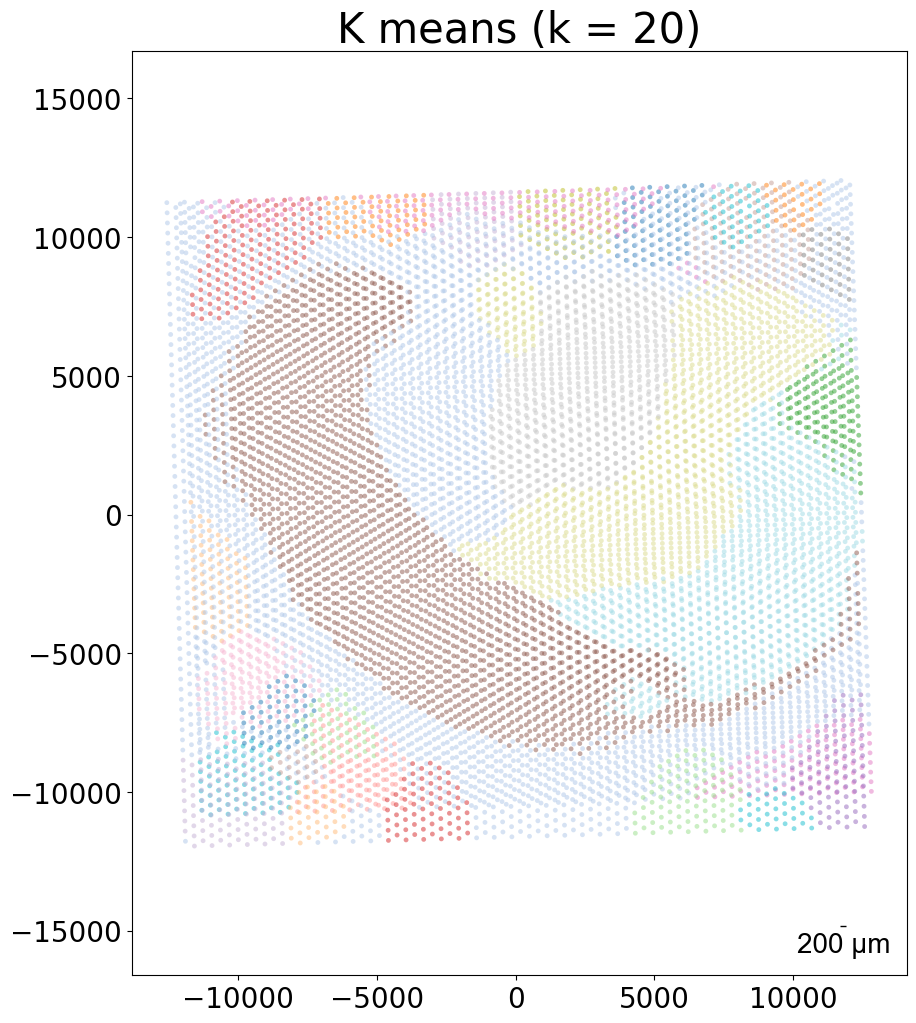
## Visualize the aligned data

from CAST.visualize import kmeans_plot_multiple


# Side-by-side plots
kmeans_plot_multiple(embed_dict,sample_list,coord_final,'demo1_new',output_path,k=20,dot_size = 30,minibatch=True)

# Overlay plot
kmeans_plot_multiple(embed_dict,sample_list,coord_final,'demo1_new',output_path,k=20,dot_size = 30,minibatch=True,plot_strategy='stack')
Perform KMeans clustering on 9975 cells...
Plotting the KMeans clustering results...
Perform KMeans clustering on 9975 cells...
Plotting the KMeans clustering results...
[9]:
array([12, 12, 4, ..., 18, 8, 9], dtype=int32)